05 / data visualization
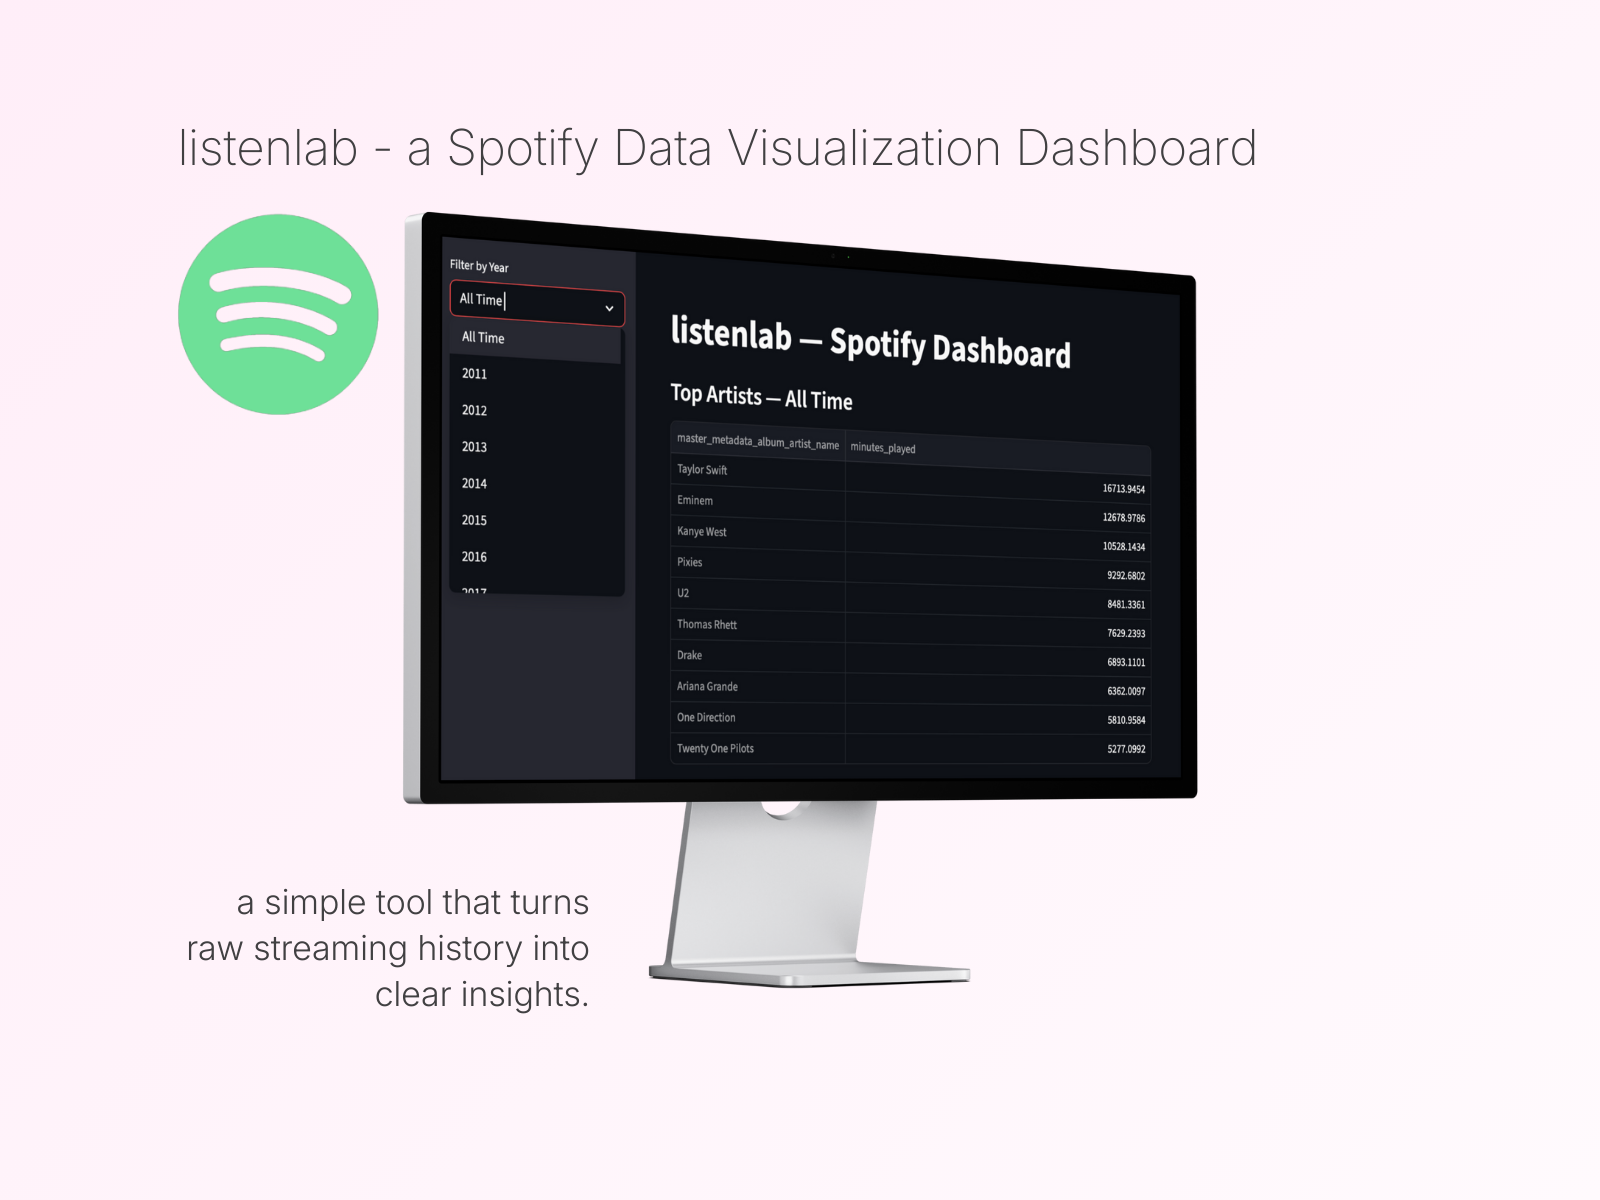
listenlab
https://github.com/sydneygrignon/listenlabA Streamlit dashboard that turns messy Spotify data exports into clean, interactive insights. Built with Python and pandas.
05 / data visualization
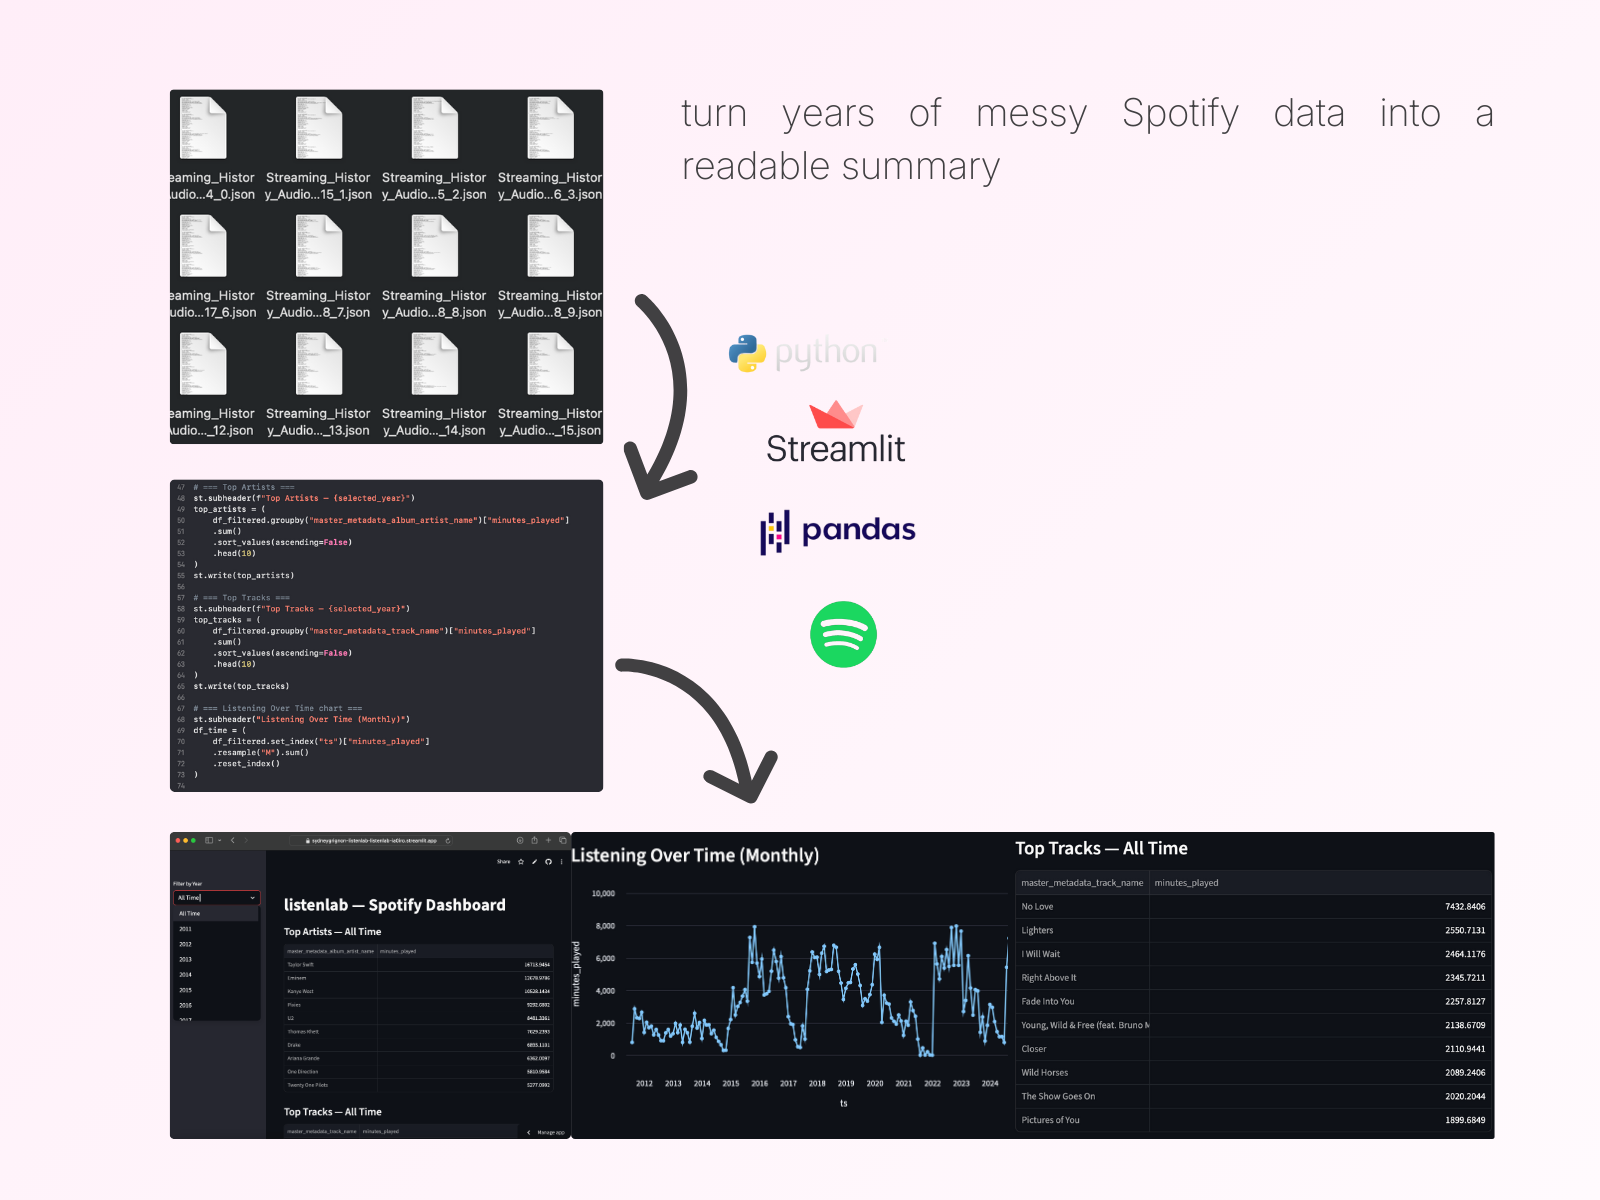
A Streamlit dashboard that turns messy Spotify data exports into clean, interactive insights. Built with Python and pandas.
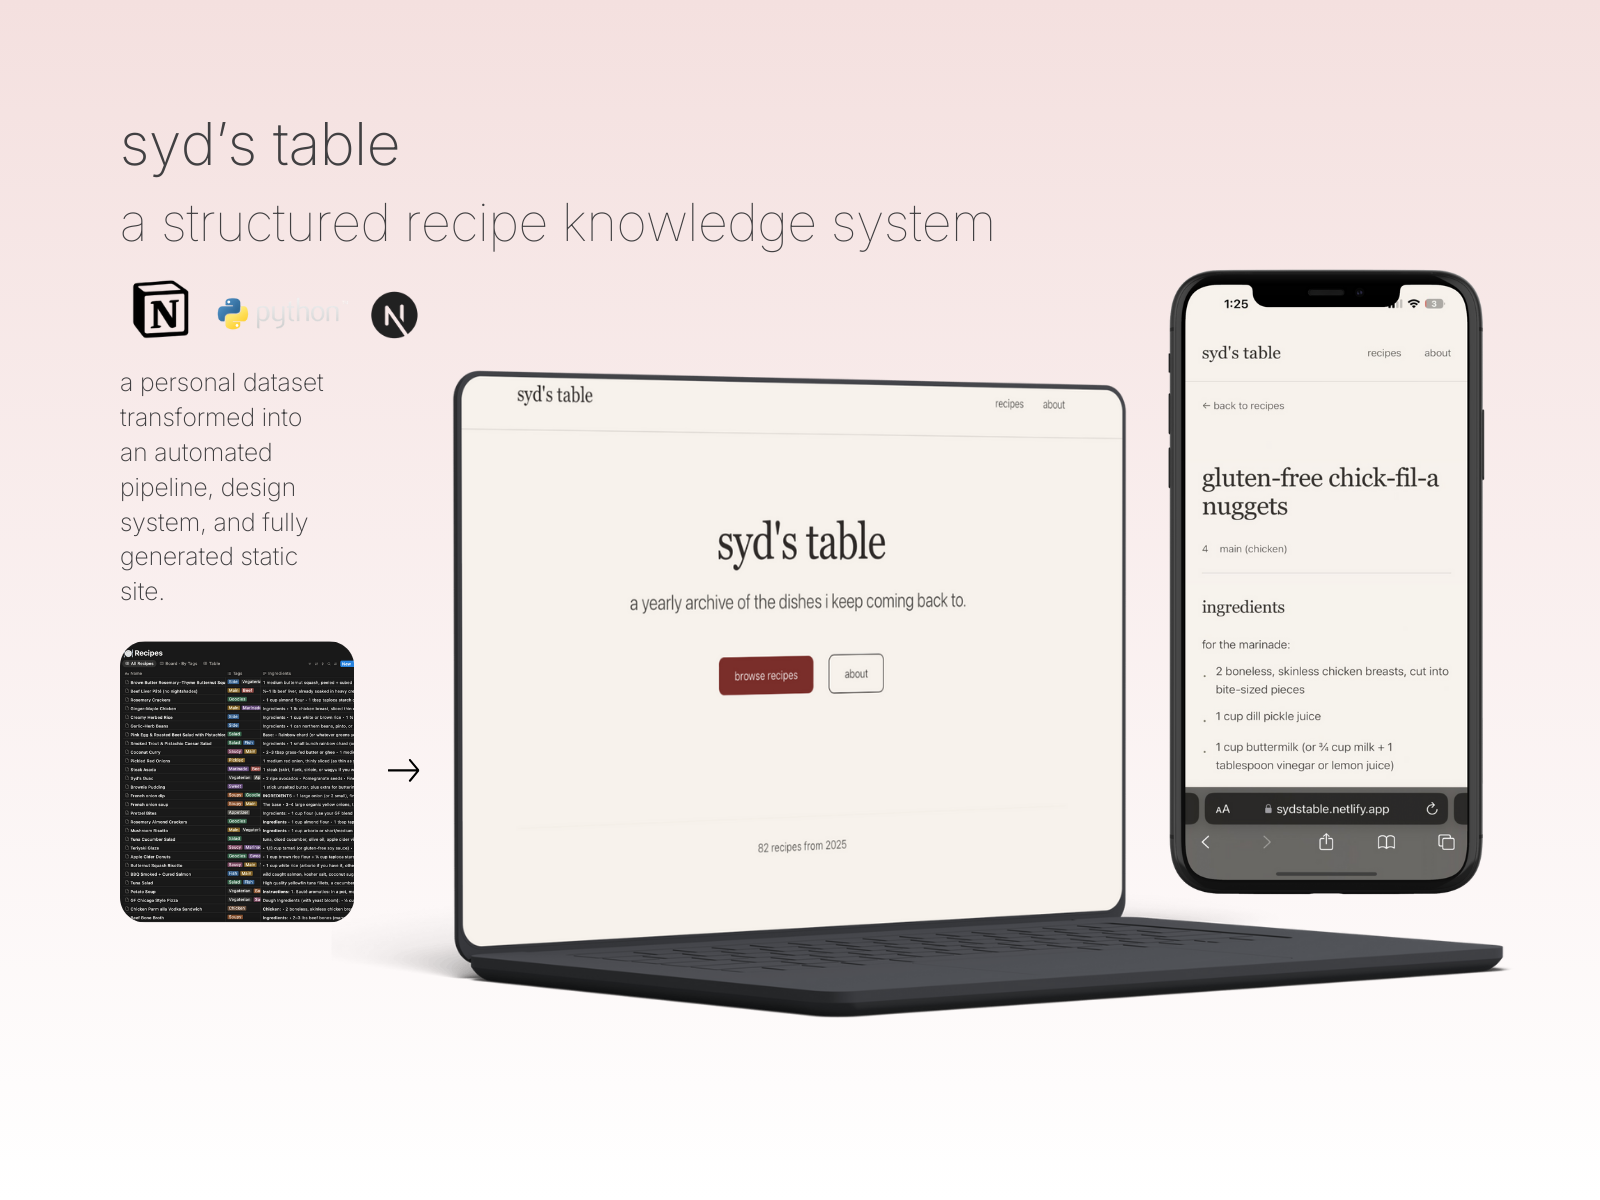
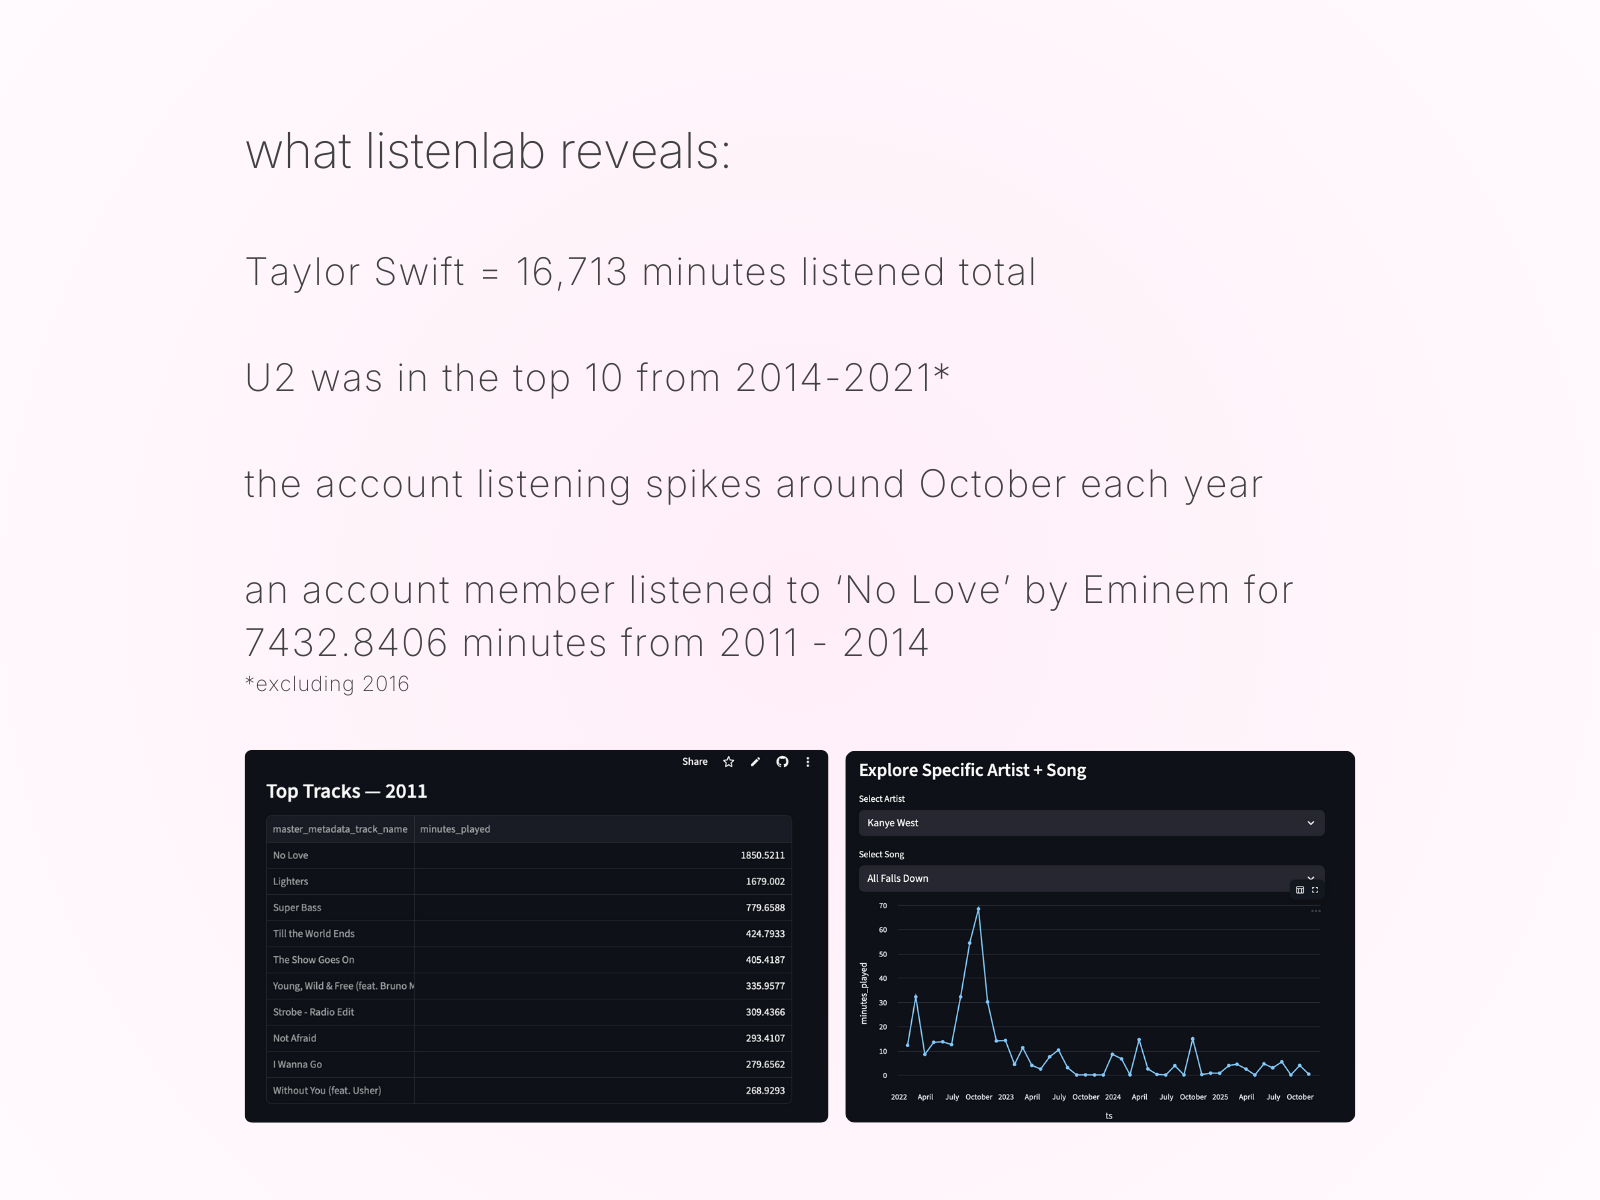
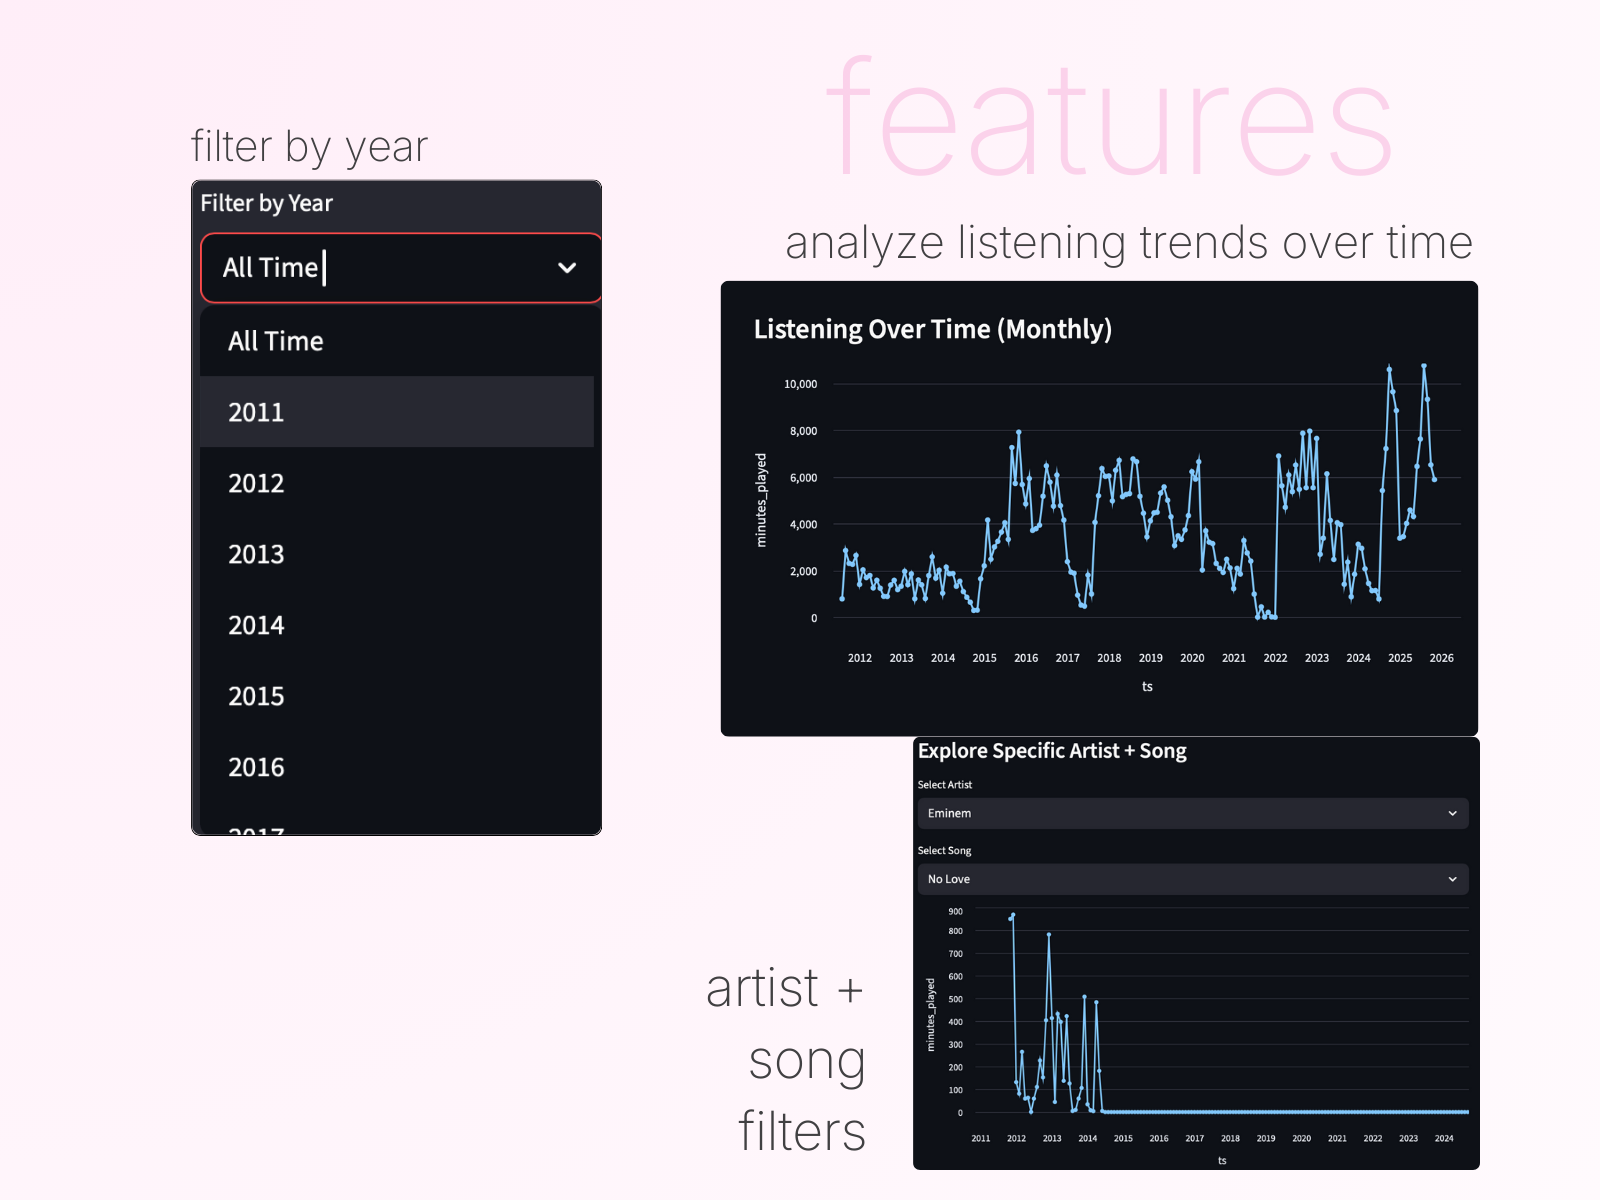
listenlab lets users upload their Spotify data export and instantly see their top artists, top tracks, and long-term listening patterns. The app parses multiple JSON files from Spotify's privacy export and merges them into a unified dataset, then displays it through interactive charts and filters.
I built this in a day because I wanted a better way to explore the music history of my family's shared Spotify account, and realized it was a great example of fast end-to-end development. It shows my ability to work with real data, build tools quickly, and ship polished features even on small projects.
ListenLab is built with Python using Streamlit for the UI layer.
The app reads and merges JSON files from Spotify's data export, cleans and aggregates the data with Pandas, and renders interactive charts through Streamlit's built-in plotting tools.
For deployment, the app runs on Streamlit Cloud, with environment setup handled through requirements.txt.
Spotify's native "Wrapped" is fun, but it doesn't let you dig into your full history. I wanted something deeper, customizable, and actually useful. I also wanted a small project to showcase my Python + data + deployment skills. Something that shows I can build functional tools with real data in a single day.
ListenLab is simple, but it does its job well. It's the kind of fast MVP I love building.